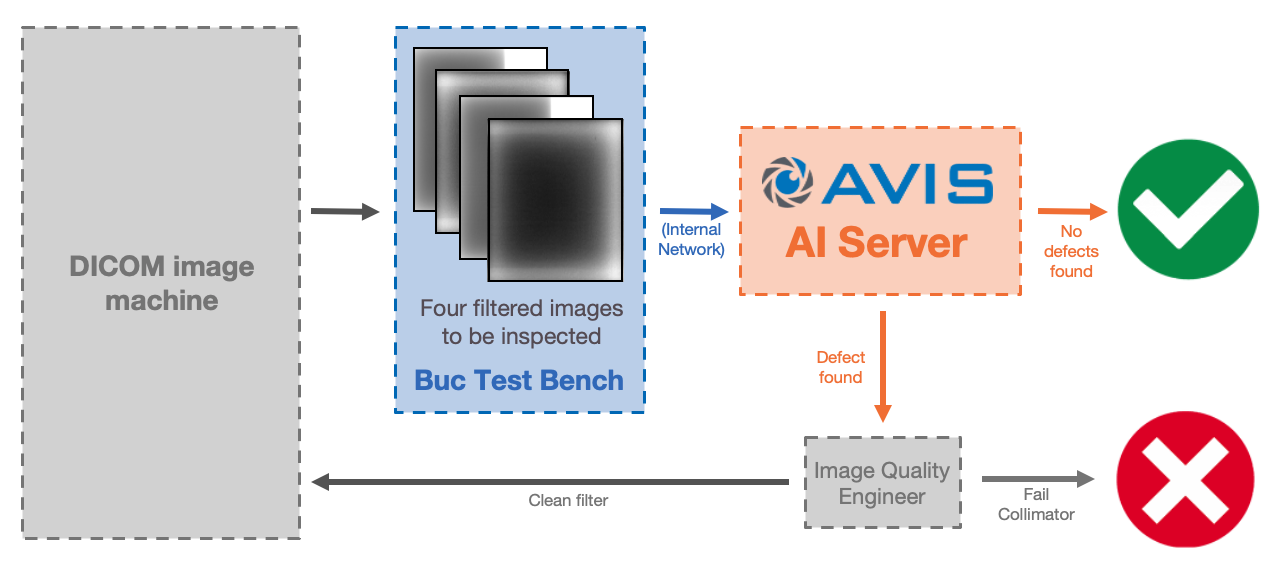
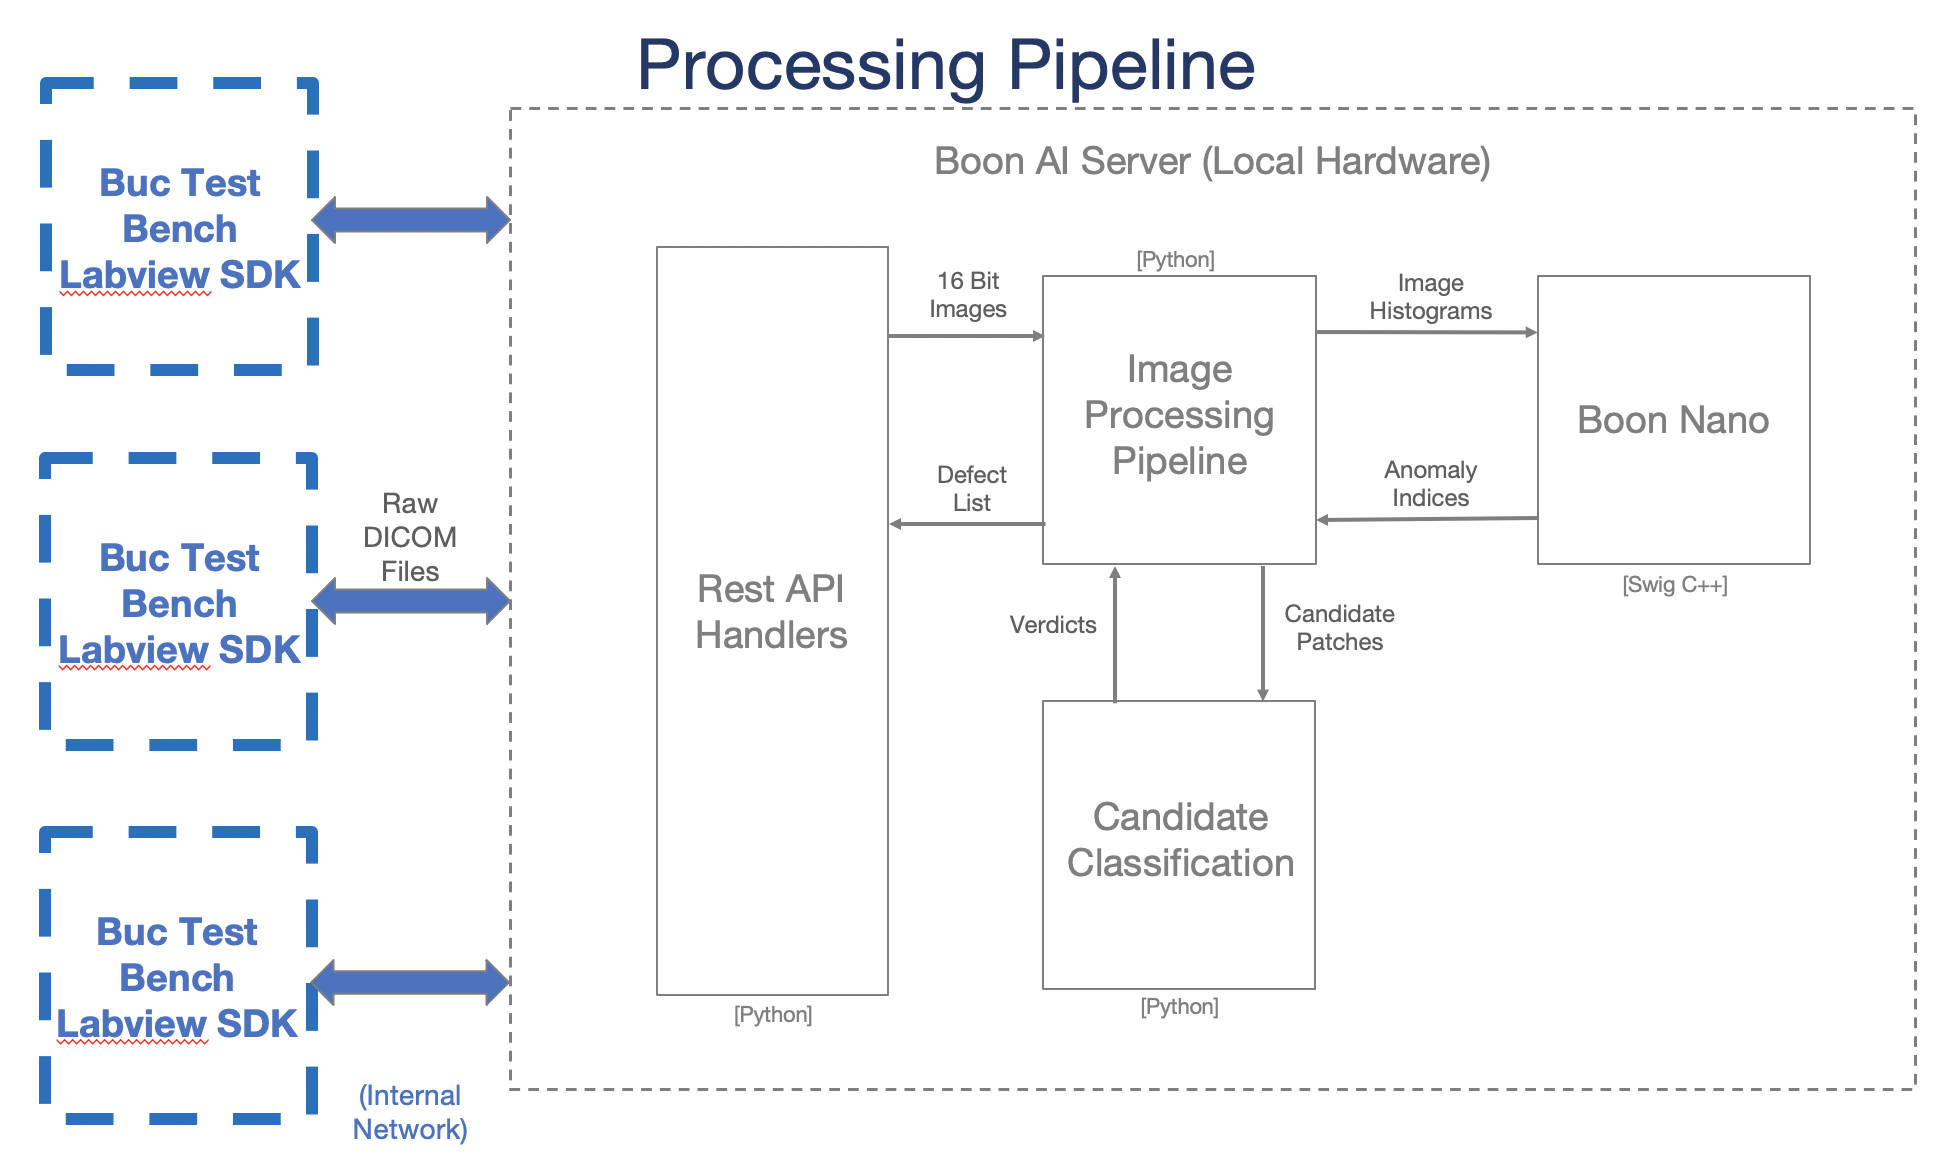
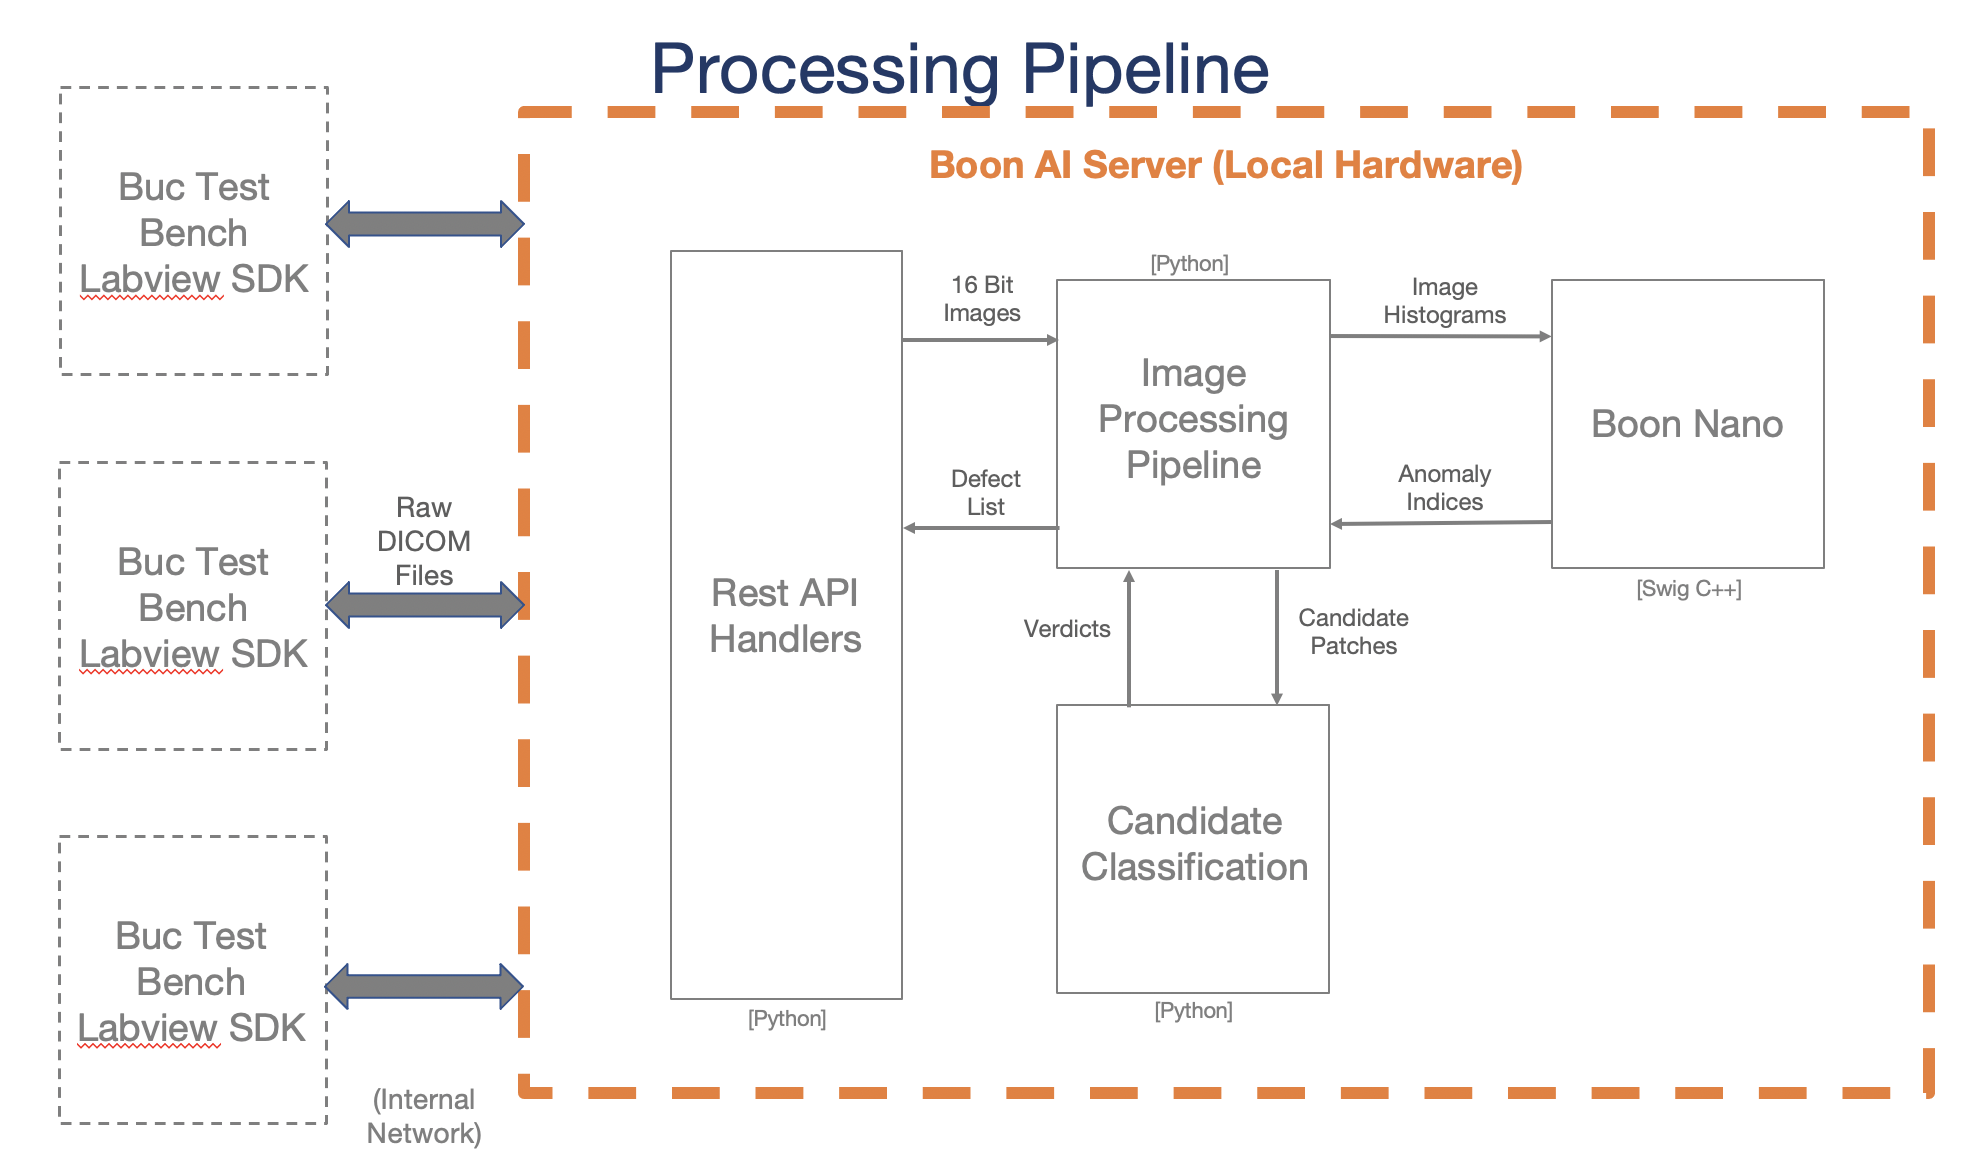
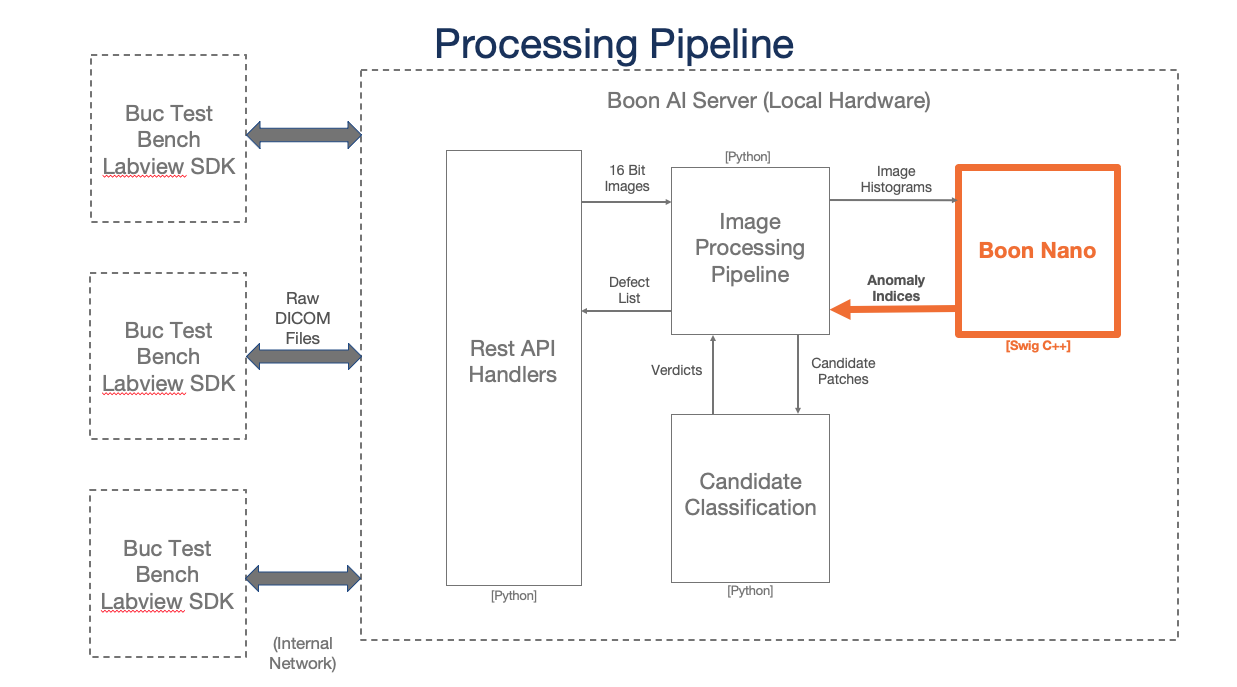
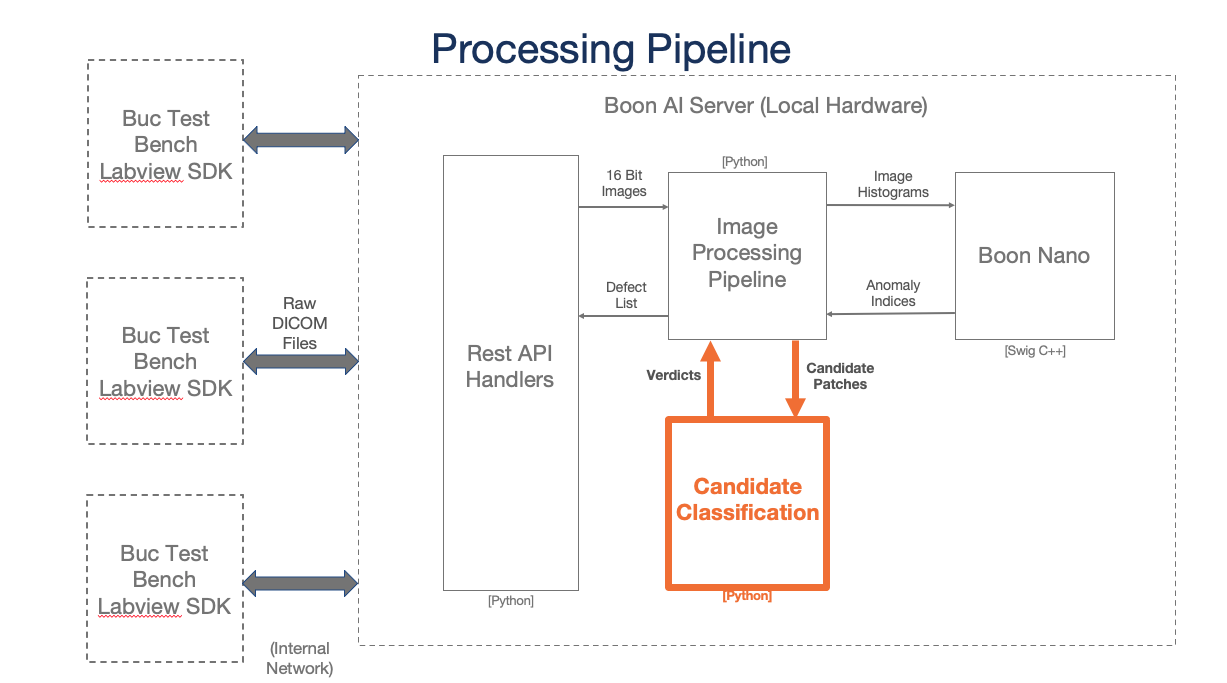
System Architecture
This server is made to process DICOM test images and return major and minor defect information to the user.
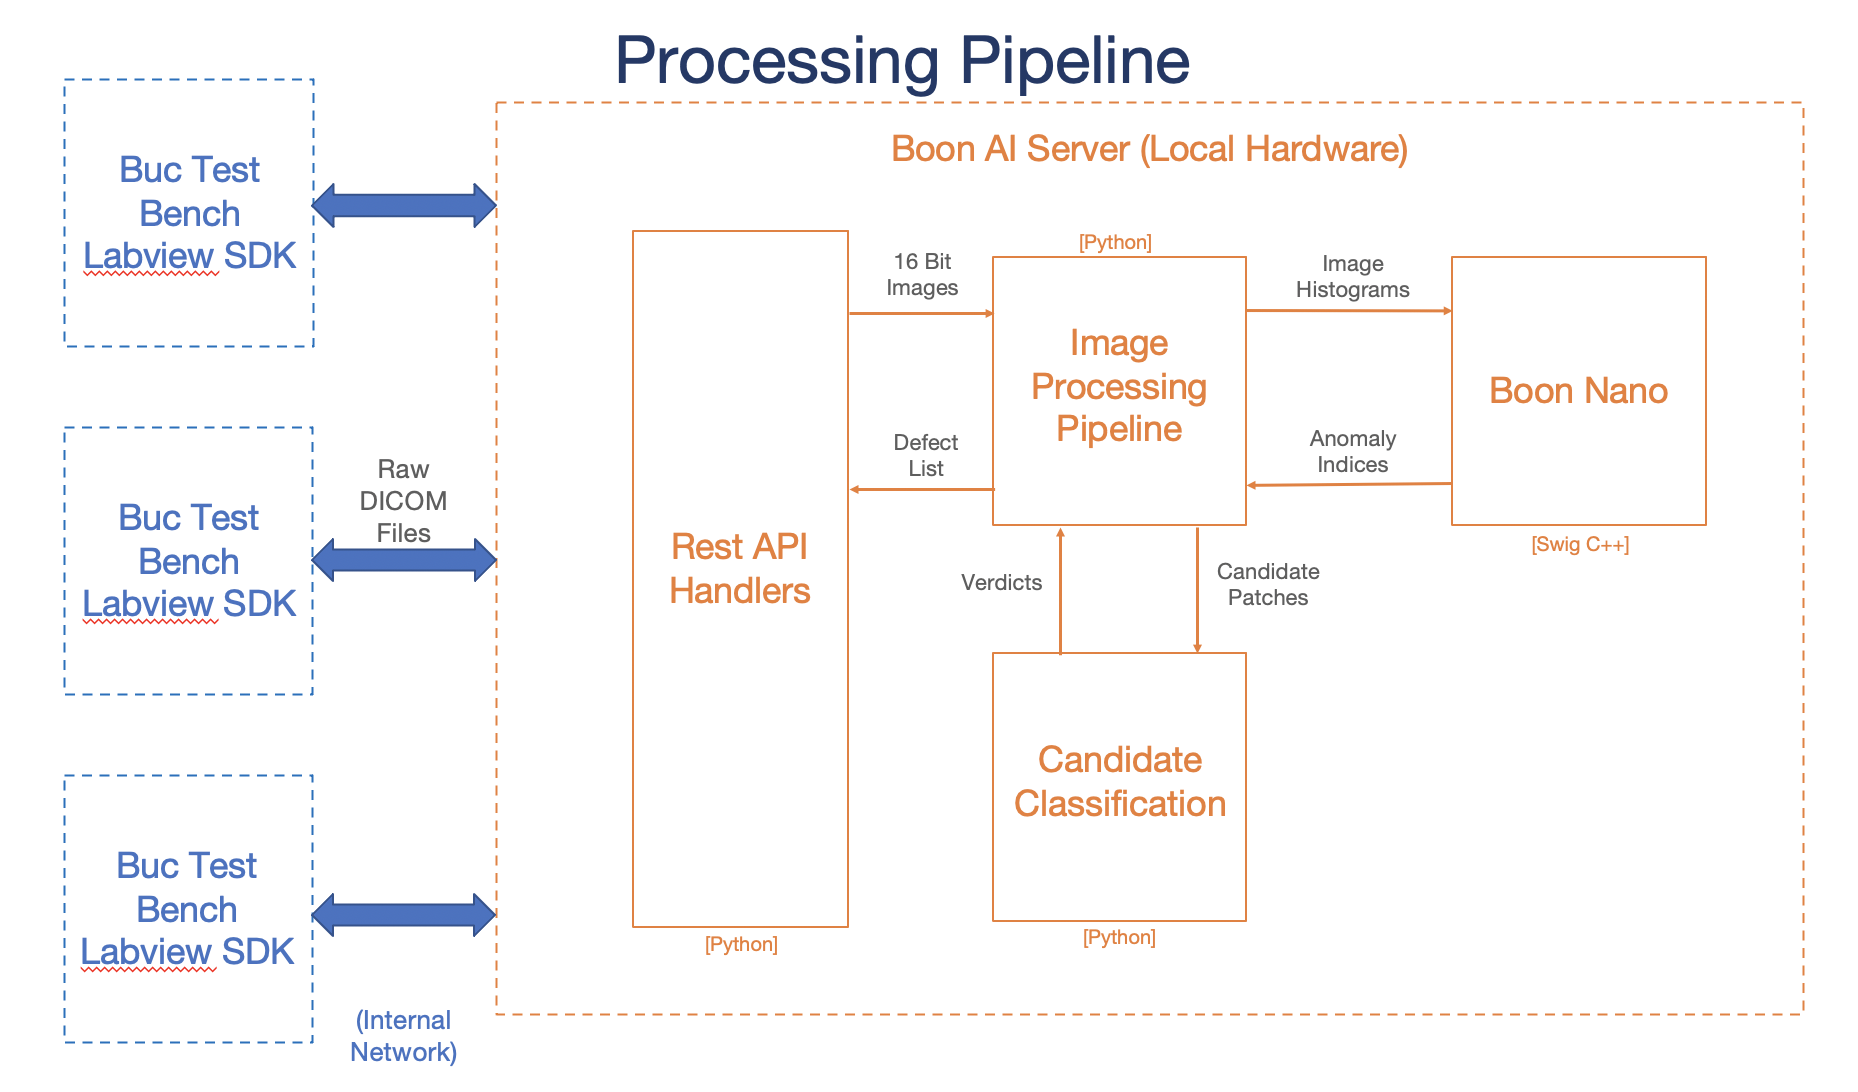
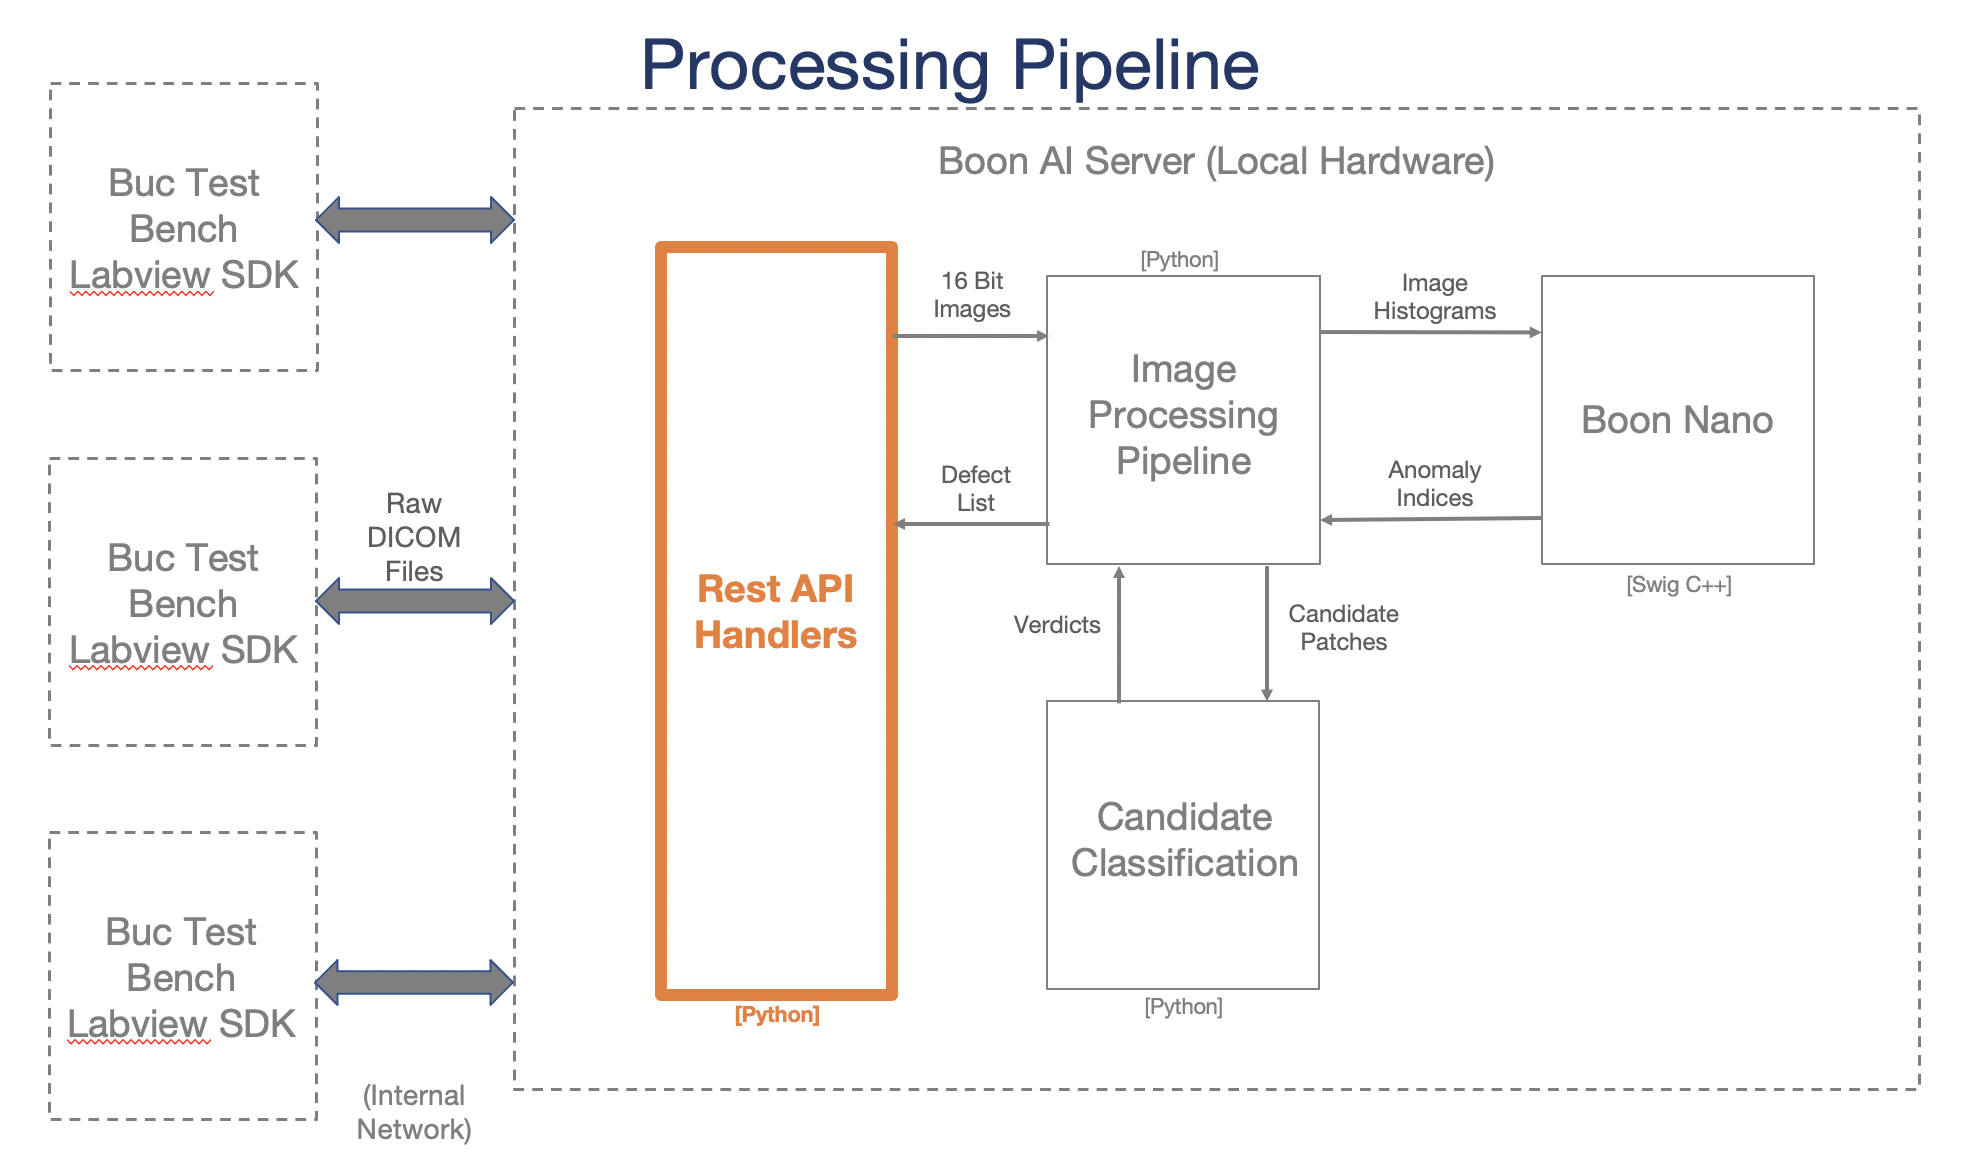
Labview SDK
Located on the test bench controller, this interfaces with the AVIS server over the internal network.
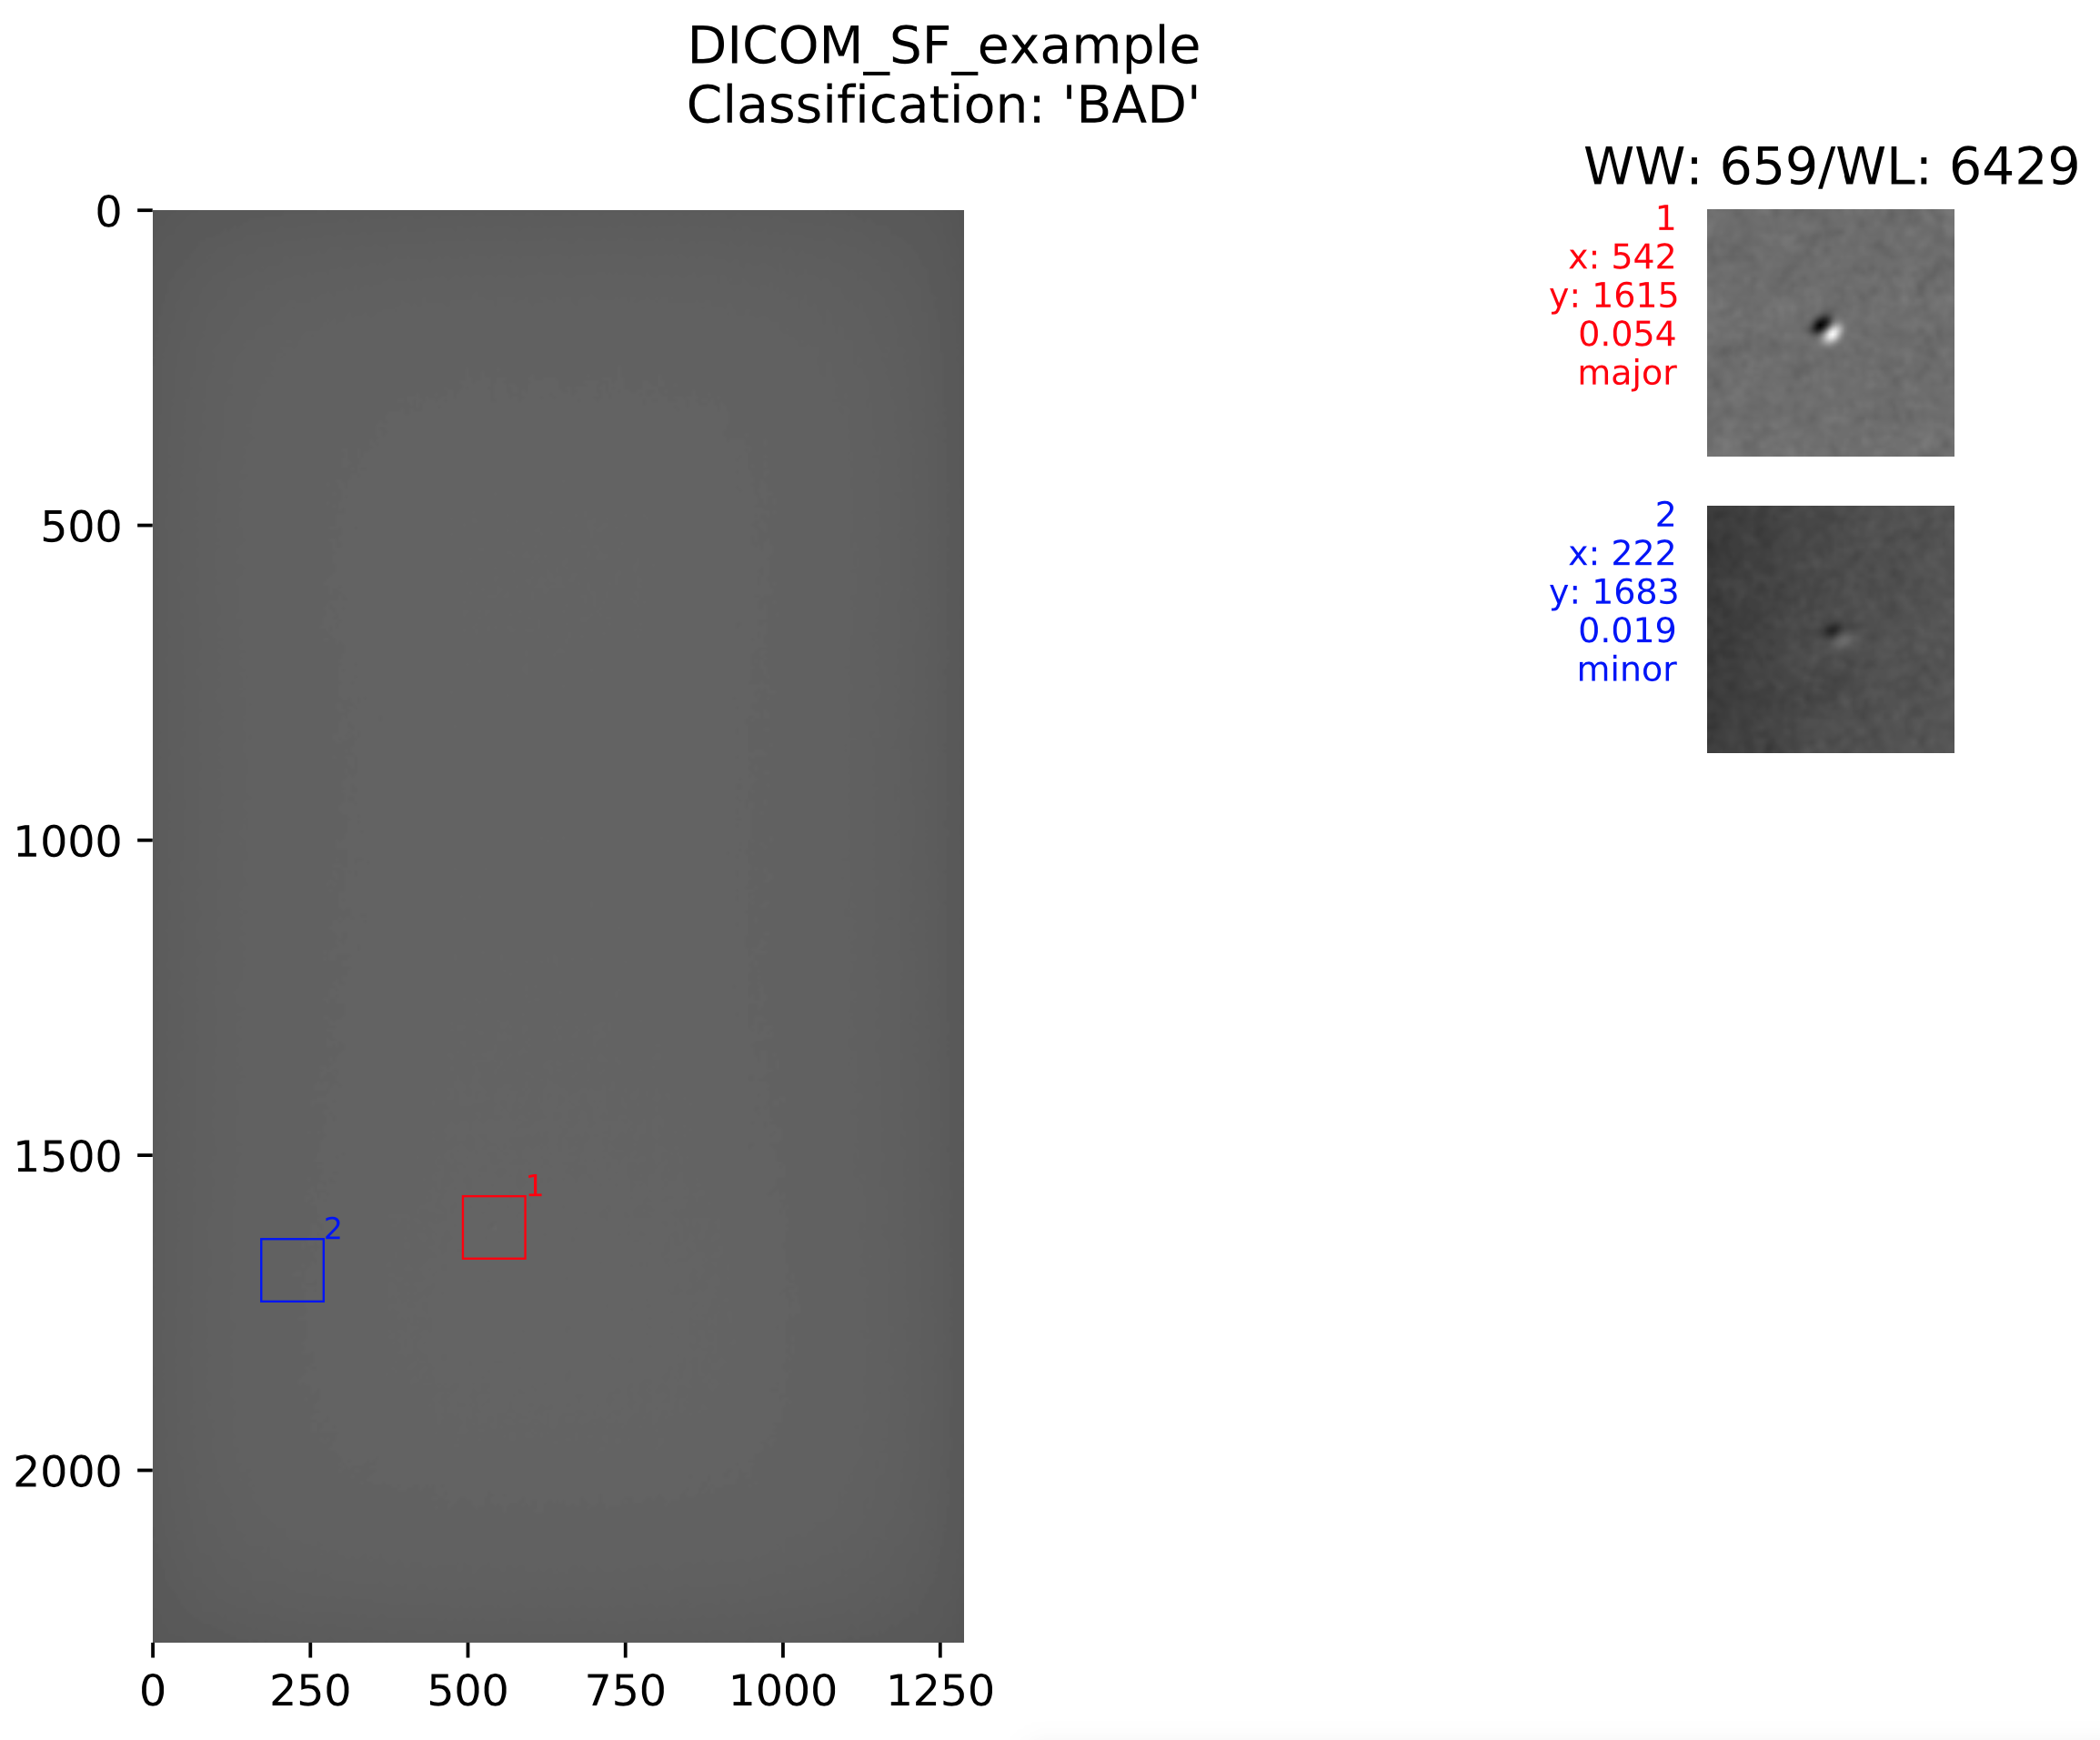
Example image
AVIS AI Server
On-prem 1U mountable rack to be delivered on site.
Specifications:
- Manufacturer Dell
- Device R240
- CPU Intel Xeon E-2288G (16 Threads)
- Memory 16 GB
- Connectivity Dual 1-Gb Ethernet Link
- Test Benches Supported 10
Features:
- On-Premise AI Inference and Training
- Up to 10 simultaneous Image Analysis Pipelines
- Boon Logic API Server
- Token Authentication
- RSA Authentication for SSH Access
- iDRAC Server Monitoring
- Boon OTA Software Update
- Simple Disaster Recovery
See the Server Connections Document for more information.
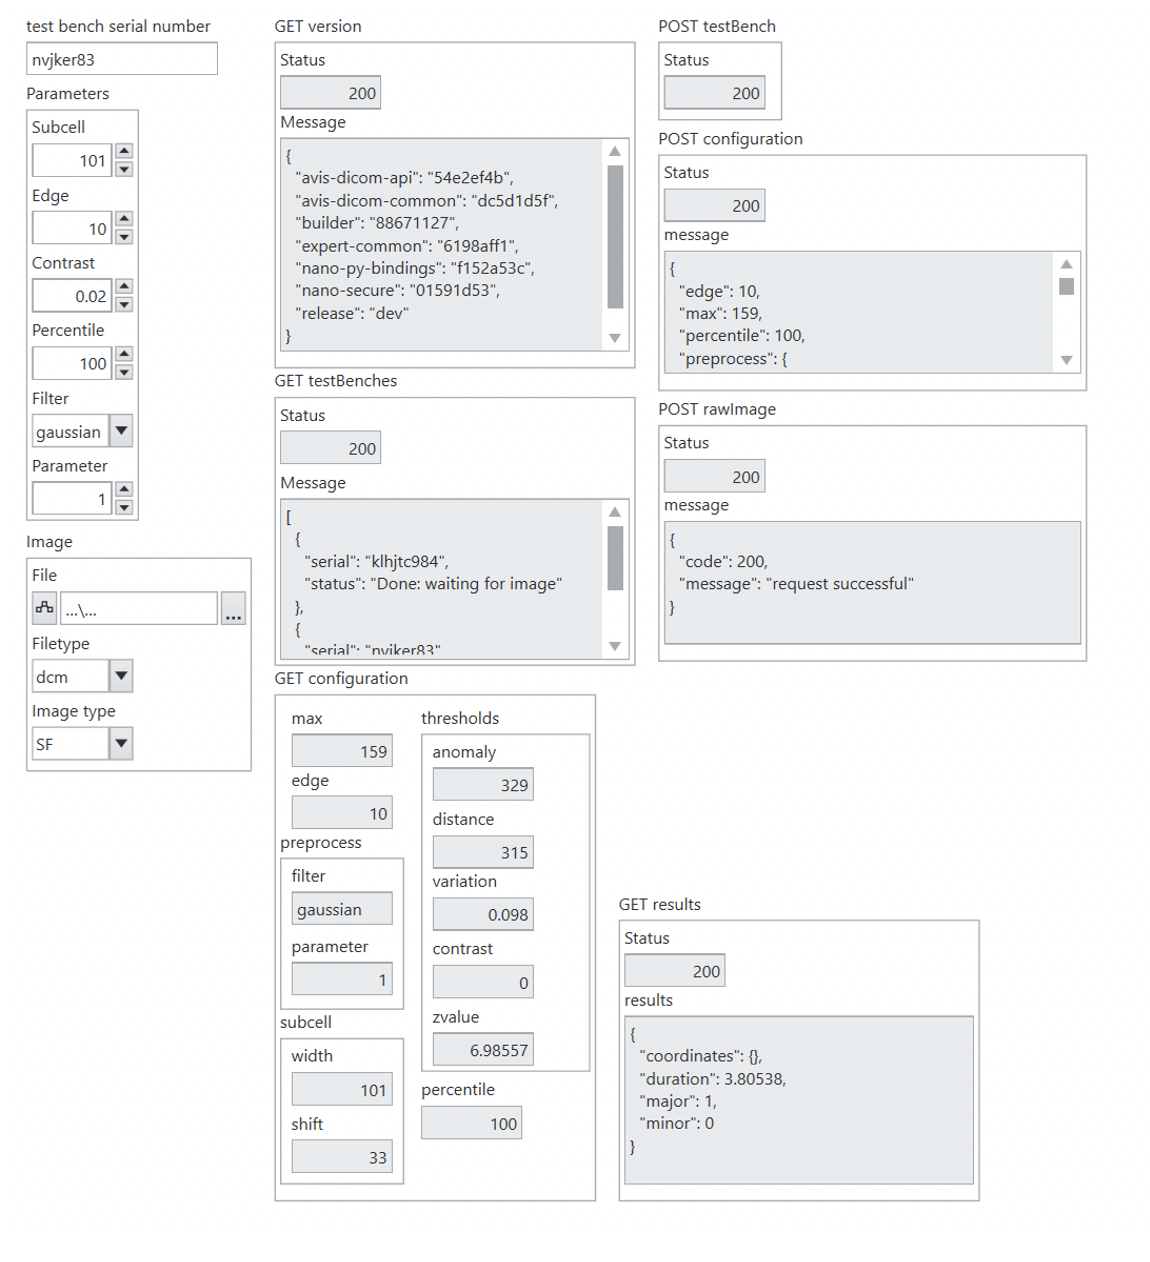
REST API
REST interface for accessing the server and its processed results.
| General | |
|---|---|
| Status | Timestamp of the call to determine if server is active |
| Version | Version numbers for all included software |
Included Software:
- avis-dicom-api
- avis-dicom-common
- builder
- expert-common
- nano-py-bindings
- nano-secure
- nano-sgx
| Test Bench | |
|---|---|
| Attach (Required) |
Assign identifier |
| Detach | Remove identifier from the list of valid test benches |
| Status | Status in pipeline of individual test bench OR List of all test benches’ statuses in their respective pipelines |
| Configuration | |
|---|---|
| Define | Set values and forego autotuning for any set values |
| Returned | Complete list of parameters used in processing of the image (including auto-set values) |
subcell
width (configurable) - number of pixels across for the subimage
shift (set) - number of pixels to shift over between each subimage
preprocess
filter (configurable) - filter to preprocess the whole image. Options are median, gaussian, or none
parameter (configurable) - parameter associated with the filter. If the filter is median, this value corresponds to the window width, if the filter is gaussian, then this corresponds to the sigma value
edge (configurable) - number of pixels to trim around the edge of the image
SFEdge (configurable) - number of pixels wide to trim the SF images
thresholds
contrastMax (configurable) - maximum contrast to apply Rose Model before automatically labelling candidate as major
areaMax (configurable) - maximum area to apply Rose Model before automatically labelling candidate as major
major (configurable) - Rose model threshold for major candidates
minor (configurable) - Rose model threshold for minor candidates
variation (set) - the distance measurement to distinguish variation between subimages (Boon value)
distance (set) - distance index between subimages’ clusters (Boon value)
anomaly (set) - frequency index for subimages’ clusters (Boon value)
max (set) - value for cropping histogram of magnitude values for each subimage
roseConstants
a0SF (configurable) - minimum area asymptote for Rose Model curve for SF images
a0LF (configurable) - minimum area asymptote for Rose Model curve for LF images
c0 (configurable) - minimum contrast asymptote for Rose Model curve
w (configurable) - scalar for Rose model curve to adjust contour spacing (high values spread out contours)
k0 (configurable) - scalar for Rose Model curve to adjust contour edge slope (high values make the curve more gradual)
| Image | |
|---|---|
| Send (Required) |
Send DICOM image to AVIS server to be processed |
| Results | |
|---|---|
| Returned (Required) |
Summary of defect values resulting from the last image processed |
image - identifier associated with the last image processed
major - number of major candidates found
minor - number of minor candidates found
coordinates
major - list of coordinates where each major defect candidate was located on the original image
minor - list of coordinates where each minor defect candidate was located on the original image
contrasts
major - list of contrast values for each major defect candidate
minor - list of contrast values for each minor defect candidate
areas
major - list of defect areas for each major defect candidate
minor - list of defect areas for each minor defect candidate
| Summary | |
|---|---|
| Returned (Required) |
Send DICOM image to AVIS server to be processed |
Example summary file
See the API Documentation for more information.
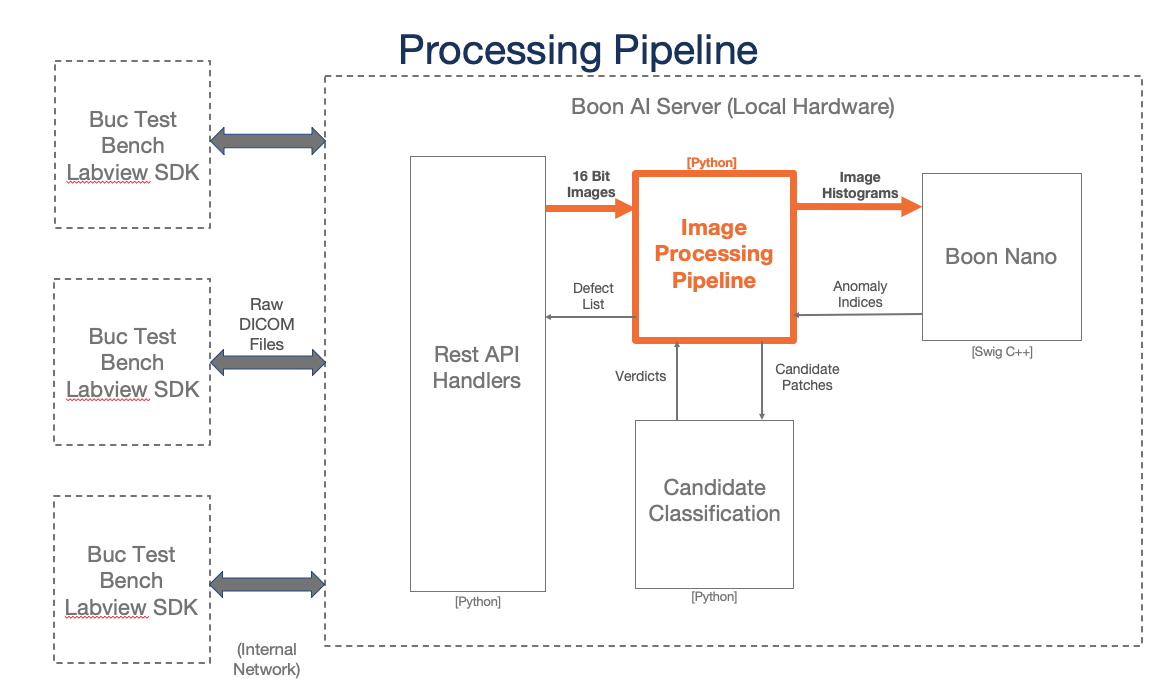
Image Process
General pipeline happening on the backend when each DICOM image is pushed to the AVIS server.
Step 1: Crop SF images
Using the image name identifier, the right edge is clipped if the DICOM image name contains the filter identifier “SF”. If the filter is LF, this step is skipped.
Step 2: Filter image
Using the specified filter type in the configuration (gaussian, median, or none), the image is passed through the filter. The filtered image is now the image used in the rest of the processing pipeline.
Step 3: Subdivide image
Using the subcell width from the configuration (in number of pixels), the DICOM image is subdivided into smaller images. The number of pixels between each subimage is the subcell shift value in the configuration.
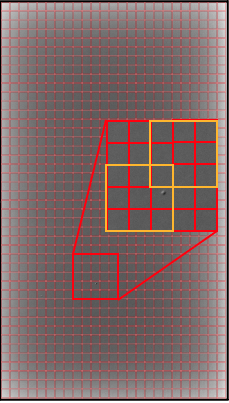
Subimages are shown in yellow. This simplified example is for a width of 3 and a shift of 2.
Step 4: Convert subimages to histograms of magnitudes
Each subimage is converted to a histogram of magnitudes using the raw pixel values. Pixel values are binned so that the histogram is has 64 bins of pixels. These histograms are what are used to create the model for each image and find any defects.
Clustering Process
Boon Logic clustering process of the DICOM image.
The histograms for the image are clustered using Boon Logic’s nano clustering technique. From the raw image, shown on the right, the resulting clusters are assigned frequency values where high values are associated with areas of the image that are different from the rest of the image regions. The image shown on the right is a contour plot of an example DICOM image’s results with areas in white depicting parts of the image that are potential defects.

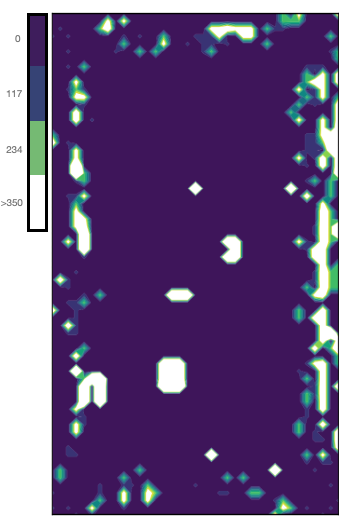
Note that areas along the edge of the image are white where the original image has a natural gradient. This will be taken into account and ignored in the classification step if those areas are indeed just gradients.
Classification Process
Process for classifying the candidates as major or minor defects.
Major candidates - above Rose model major threshold
Minor candidates - above Rose model minor threshold
Factors
Distance
- Cluster distance from other clusters created throughout the image
- 95th percentile of all distance indexes within the image is the threshold
- Candidates above the threshold are selected
Frequency
- Cluster frequency compared to other clusters created throughout the image
- 95th percentile of all frequency indexes within the image is the threshold
- Candidates above the threshold are selected
Contrast
- Select candidate subimage pixel values between the 10th and 90th percentile for the subimage
- Fits each candidate subimage to a plane using the selected pixels from previous step
- Find the difference between the min pixel value and the expected plane value (as well as the difference between the max and the plane)
- Difference value divided by the expected plane value gives the contrast measurement
- Contrast value is compared to the threshold value
Area
- Select candidate subimage pixel values between the 10th and 90th percentile for the subimage
- Finds the mean and standard deviation for the pixels selected in previous step
- Threshold is four times the standard deviation added to the mean
- Count pixels in subimage that are above the threshold or below the negative threshold
Rose Model
- Using a Rose Model inspired function, calculate Rose Model value for comparison against the major and minor thresholds (see reference)
Deliverables
* 1U rack-mountable server (see AVIS DICOM Server section)
* Results values
- Major candidate count
- Minor candidate count
- Coordinates of major candidates
- Summary image of the locations of the candidates and the window level/window width used for displaying the image
AVIS Enabled Process